

COGS represents the direct cost of producing your menu items.
Here’s how to calculate your food cost or COGS:
COGS % = Beginning Inventory + Purchases – Ending Inventory
For example:
COGS = $10,000 + $30,000 – $8,000 = $32,000
Industry benchmarks suggest your food cost should be between 28-32%. Higher numbers might indicate portion control issues or waste problems.
To calculate your COGS %,
COGS % = (Beginning Inventory + Purchases – Ending Inventory) ÷ Food Sales × 100 |
In this case, COGS % = ($10,000 + $30,000 – $8,000) ÷ $80,000 × 100 = 40%
Staffing is tricky to navigate. You want enough helping hands during the rush, but idle employees quickly inflate expenses. Tracking your labor costs keeps things in check.
Labor costs include:
To calculate total labor cost:
Total Labor Cost = Wages + Payroll Taxes + Benefits + Workers Comp + Other Costs |
Next, determine the labor cost percentage:
Labor Cost Percentage = Total Labor Cost ÷ Total Revenue x 100 |
Now, let’s say, after a thorough analysis of items including wages, payroll taxes, etc, the total labor costs were $32,000.
In this case, the labor cost percentage would be $32,000 ÷ $102,000 x 100 = 31.27%
Operating expenses keep the lights on – literally. This covers recurring costs like rent, utilities, insurance, cleaning supplies, credit card processing fees, and more.
These costs typically fall into:
To determine the operating cost:
Operating Cost = Sum of all operational expenses + COGS |
For example, if monthly operating expenses are $22,000 and going by the previous example, your COGS is $32,000, your operating cost would be a sum of both numbers, i.e, $54,000.
We’ve covered all the building blocks. Now let’s examine prime cost – the combined total of COGS and labor costs.
The formula is straightforward:
Prime Cost = COGS + Total Labor Cost |
For our example restaurant:
Prime Cost = $32,000 + $32,000 = $64,000
Next, determine the prime cost percentage:
Prime Cost Percentage = Prime Cost ÷ Total Revenue x 100 |
In this case, it’s: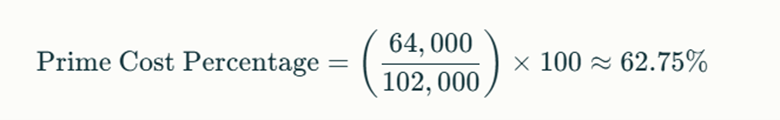

Now for the moment of truth – calculating your profits.
Understanding both gross and net profit margins is crucial to gauge the health of your restaurant. These metrics cut through the noise and tell you what’s actually lining your pockets.
Gross profit looks at profitability before factoring in overheads and operating expenses. It gives you a high-level snapshot of how much money your core operations are generating.
Here’s the formula:
Gross Profit = Total Revenue − Cost of Goods Sold |
For example:
Gross Profit = $250,000 – $100,000 = $150,000
To benchmark your performance, it is also ideal to calculate your gross profit margin percentage:
Gross Profit Margin = (Gross Profit ÷ Total Revenue) × 100 |
While gross profit provides a preview, net profit factors in ALL expenses and reveals your actual bottom line.
This is the ultimate indicator of the health and sustainability of your operations.
Here’s how to calculate it:
Net Profit = Gross Profit − Total Operating Expenses |
For example:
Net Profit = $150,000 – $130,000 = $20,000
Aim for at least 6-10% net profit margins. Consistently negative or declining net profits could signal serious problems.
Monitoring both gross and net profits allows you to catch issues early before they start eroding your bottom line.
Related Article: What Is PPA in Restaurants: The Key to Increasing Profit
Your restaurant’s profit and loss statement (P&L) tells the story of your business. It reveals your revenue, costs, and ultimately, your profits. Without regularly reviewing this vital document, you’re operating in the blind.
Monitoring your P&L helps you make smart menu engineering decisions. You can pinpoint unprofitable dishes to remove or repriced items to boost margins. It also aids staffing optimization by showing if labor costs are too high so you can adjust schedules accordingly.
In terms of cost control, your P&L breaks down operating expenses so you can find areas to trim fat. It also allows you to gauge the impact of any cost-cutting measures you implement.
When it comes to driving revenue growth, tracking sales metrics helps you determine effective marketing strategies and menu offerings.
As for improving overall profitability, your P&L gives you the data to set targets and benchmark success.
In short, neglecting your P&L means leaving money on the table.
So review it regularly, understand the story it tells, and use those insights to build a thriving restaurant business.

Running a restaurant comes with its fair share of financial complexities. But your P&L statement doesn’t have to be one of them.
Follow these 6 best practices to get the most value out of your P&L, spot issues early and make informed decisions:
Review your P&L statements weekly to spot trends and address issues early.
Daily flash reports help track key metrics like sales and labor costs. Monthly deep dives give you a broader perspective on business performance.
Quarterly reviews help identify seasonal patterns and long-term trends.
Include your management team, accountant, and financial advisor in reviews.
Your chef should analyze food costs, while your operations manager can focus on labor efficiency.
Regular team meetings ensure everyone understands their role in financial performance.
Deciphering the story behind the numbers becomes much easier when you determine 2-3 key metrics to track in your P&L.
For restaurants, crucial KPIs typically include:
Monitoring these vital indicators every time you review your P&L provides consistency and helps you catch concerning cost creep.
Simply reviewing your P&L isn’t enough. You need to actually use those insights to drive change.
After each assessment, pick 1-2 priority areas for improvement, like lowering food or labor costs. Then develop SMART action plans outlining specific steps you will take and who is responsible for executing those strategies.
Even seasoned restaurateurs can fall victim to common P&L pitfalls. Be sure to avoid:
Little costs like cleaning supplies, linens, and credit card fees add up. Review all line items.
If costs aren’t accurately classified, your data becomes meaningless. Verify where each expense belongs.
Spotting trends requires consistency and discipline in your accounting process. Standardize how costs get recorded.
Look at year-over-year as well as week-to-week numbers to see the bigger picture behind fluctuations.
Understand how seasonal factors uniquely impact your metrics to separate true red flags from expected swings.
Smart financial tracking starts with the right tools. Modern accounting software designed specifically for restaurants can automatically track daily sales, categorize expenses, and generate detailed P&L reports at the click of a button.
Look for platforms that integrate directly with your POS system – this integration typically reduces accounting errors by 35% and saves 5-7 hours of manual data entry each week.
While basic accounting software works for smaller operations, growing restaurants benefit from comprehensive restaurant management systems that combine:
Pro tip: Partner with an accountant who specializes in restaurants. They understand industry-specific metrics and can help you spot profit-draining issues before they become problems. Our data shows restaurants working with industry-specific accountants and agencies typically maintain 3-4% higher profit margins than those using general accountants.
Most importantly, implement a robust inventory management system. Accurate inventory tracking management helps you maintain ideal COGS percentages and prevents profit leaks from over-ordering or waste.

Many restaurant owners view P&L as their financial bible. But here’s the truth – it’s just one chapter in your success story.
To truly maximize your restaurant’s profitability, you need to look beyond the numbers and embrace a holistic approach that includes strategic marketing initiatives.
Marketing impacts every line of your P&L:
At Restaurant Growth, we’ve helped 4000+ restaurants transform their P&L statements through our comprehensive marketing approach.
What can you expect? 3X increase in profits!
Here’s what sets us apart:
Ready to see those numbers climb on your P&L statement?
Creating a P&L for a restaurant starts with gathering all your income and expenses over a set period. Organize everything into categories like COGS and operating expenses.
Then, use Excel or accounting software to add up the totals for each category. Finally, structure it into an easy-to-read format listing all income at the top followed by expense categories.
Advertising and promotion expenses cover any costs associated with marketing your business and driving sales.
Common examples include fees for social media advertising, website hosting, printing menus or signage, distributing flyers, and even hosting events like tasting nights. Any expenses that aim to boost brand awareness and attract new diners would fall under this umbrella.
There’s no universal “good” P&L percentage across the board. An upscale steakhouse and quick-service pizza joint will have very different metrics.
However, understanding your restaurant’s P&L percentage, analyzing it over time, and benchmarking against similar restaurants can provide an indicator of financial health.